Build a BMI calculator with graphic output
Last updated: October 7, 2021.
BMI (body mass index) is an indicator of whether someone is of a healthy weight, calculated on their basis of height and weight.
It is calculated as follows:
BMI = height / weight²
As a result of this calculation, a single statistic is produced. BMI results are interpreted as follows, according to the World Health Organisation (WHO):
| Interpretation | Score |
|---|---|
| Underweight | <18.5 |
| Healthy | 18.5–24.9 |
| Overweight | 25–29.9 |
| Obese | 30 or greater |
In this project, we will create the functionality to make this calculation in JavaScript on the basis of user inputs for height and weight. We will also display the result graphically, placing a cross on a BMI chart for more attractive and engaging interpretation.
What we will build
Below is a preview of what we will be building. In this tutorial, we focus on creating a functional BMI calculator using JavaScript. However, we do also include some basic CSS at the end, upon which you may wish to customise!
See the Pen by James (@openjavascriptadmin) on CodePen.
Part 1: HTML template and BMI calculation with JS
Before calculating BMI, we have to create user inputs so that we can feed in a user’s height and weight to the calculation. For this, let’s create some HTML markup. First, we create a wrapper div. Inside, we create a form with two number inputs and a submit button of type submit. After the form, we place a div with the id of output-container. We will print the result of the BMI calculation inside of this div.
    <div id="wrapper">
        <form id="form">
            Height (m):  <input id="inputHeight" type="number"><br>
            Weight (kg): <input id="inputWeight" type="number"><br>
            <button id="btn" type="submit">Calculate BMI</button>
        </form>
        <div id="output-container">Your result will appear here</div>
    </div>
We can now move to JavaScript to program the calculation. For this, we need to select the form elements inputHeight and inputWeight. We also want to select the form and add an event listener to it that listens out for a submit event (this is triggered by the button, which is of type “submit”). When this is pressed, we want to reference a calculation function that we will create next. Let’s call this runCalculation.
Your initial code should look something like this:
const inputHeight = document.getElementById('inputHeight');
const inputWeight = document.getElementById('inputWeight');
const form = document.getElementById('form');

form.addEventListener('submit', runCalculation);
Next, we need to create the runCalculation function.
The function should (1) get the value of inputHeight, (2) get value of inputWeight and (3) run the BMI calculation (BMI = height / weight²). We can do this as follows:
This can be done as follows:
function runCalculation(e) {
    e.preventDefault()
    let result;
    result = inputWeight.value/(inputHeight.value*inputHeight.value);
}
In order to stop the page refreshing when the submit event occurs, we take e (the event that is automatically available to us when a form is submitted) and apply the .preventDefault() method.
This code is already enough to calculate BMI on the basis of user input! By adding console.log(result) after the calculation, we are able to see the outcome in the browser console. Test it out! If a BMI score is not logged, review the previous steps.
Outputting the the DOM
If a BMI value is logged to the console, we are now ready to output this to the DOM so that it is visible to the user. We can print the inputs and the result of the BMI calculation to the DOM using a template string:
    const output = `
    <span>Your height is:<br><b>${document.getElementById('inputHeight').value} metres</b></span><br>
    <span>Your weight is:<br><b>${document.getElementById('inputWeight').value}kg</b></span><br>
    <span>Your BMI is:<br><b>${result.toFixed(1)}</b></span><br>
    `

    const outputContainer = document.getElementById('output-container');
    outputContainer.innerHTML = output;
The .toFixed method is applied to result in the template so that it is rounded to one decimal place when rendered to the DOM.
And that’s all the code we need to render a user’s BMI score to the screen. If you test your application with some input values now, you should see something like this on screen:

It isn’t pretty. But it is functional! We will return to improve the UI a little at the end of the tutorial 😉
Part 2: Representing BMI graphically
To display the result graphically, we need a BMI chart upon which we can map the result. For this tutorial I will be using the one below, available via the Wikipedia Commons. But the techniques we are going to cover we be easily be applied to a different chart.

First of all, we need to add some HTML adding the BMI chart to the page. Let’s place this after all the HTML relating to the calculation:
<div id="wrapper">
<form id="form">
Height (m): <input id="inputHeight" type="number"><br>
Weight (kg): <input id="inputWeight" type="number"><br>
<button id="btn" type="submit">Calculate BMI</button>
</form>
<div id="output-container">Your result will appear here</div>
</div>
<!-- new HTML below -->
<div id="graphic-container">
<img id="chart" src="https://upload.wikimedia.org/wikipedia/commons/c/cc/BMI_chart.png" alt="BMI chart" width = "800px">
<span id="x">❌</span>
</div>
Notice that we give the BMI chart a fixed width of 800px. You can enter your own width value, but it is important that it remains fixed for calculations for later calculations.
Also note that we have also included a span element inside the container with an id of x and containing the HTML code ❌ (❌). It is this cross that we will position on the graph on the basis of user input. Feel free at this point to customise with a different icon or image!
Because we do not want the icon to appear before it is placed on the page, add the following CSS styling to hide it:
    #x {
        display: none;
    }
Creating the graphic display function
Now, we need to create a function that will calculate where we need to place ❌ along the x-axis (horizontal) and y-axis (vertical) of the chart. And we need to add another ‘submit’ event listener to the form so that this function is fired when the button with type submit is clicked. We do this in the following code:
form.addEventListener('submit', displayResult);

function displayResult(e) {
   e.preventDefault()
}
Now for the calculation itself. In substantive terms, what we want to do is as follows:
- Get the value of input height;
- Subtract 1.43 so that:
- If the user enters 1.43 (the lowest possible value on the chart), it is now 0;
- If the user enters 2 (the greatest possible value), it is now 0.57;
- Divide this number by 0.57 (the greatest possible value) so that the number now ranges from 0 to 1
- Multiply this number by the number of pixels between 1.43 and 2 on the x-axis (374);
To help with calculating the axis length, one can use the following code, adapted from Grepper:
function printMousePos(event) {
  console.log(
    "clientX: " + event.clientX +
    " - clientY: " + event.clientY);
}
document.addEventListener("click", printMousePos);
This function will log the position of wherever you click in the browser to the browser console.
Now we have a scale in the correct number of pixels. But, for the y-axis, we actually need to reverse the scale so that the lowest number entered by the user is the greatest number (because the lower values of the y-axis are further away from the top of the screen).
We can do this by subtracting the greatest possible scale number (374). But this would create a negative scale. So we use Math.abs() to remove to remove the negative sign: Math.abs(sum-374).
However, our work is still not done. We still need to account for the space (1) between the image and the top of the screen and (2) between the edge of the image and the start of the y-axis. For the first of these, we can calculate the space dynamically using offsetTop. The second of these will vary according to the image size. At 800px image width, it is 37px. Again, this was calculated using the code snippet above.
One final value to account for is that the icon appears below the point we specify. To adjust for this, we need to subtract around 11px from the vertical placement.
In code this process should look something like the following:
btn.addEventListener('click', displayResult);

function displayResult(e) {
    e.preventDefault()
    // get chart
    const chart = document.getElementById('chart');

    //yaxis
    let ysum = (((document.getElementById('inputHeight').value)-1.43)/0.57)*374
    ysum = Math.abs(ysum-374)
    yMark = ysum+chart.offsetTop+37
    yMark = yMark - 11
}
We then extend our function by doing the same for the x-axis (though, in this case, there is no need to reverse the scale):
    // xaxis
    let xsum = (((document.getElementById('inputWeight').value)-36)/88)*734
    xMark = xsum+chart.offsetLeft+32
    xMark = xMark - 11
Finally, we need to select ❌ and change its styling properties so that it is placed where we have calculated it to be already in our function. So we extend the function with the following code:
    //get icon
    let x = document.getElementById('x');

    //position and style icon
    x.style.position = "absolute"
    x.style.top = yMark+"px"
    x.style.left = xMark+"px"
    x.style.fontSize = "20px"
    x.style.fontWeight = "bold"
    x.style.display = "inline-block"
Note that we have set display to inline-block. This is very important because ❌ is by default not visible in the base CSS that is applied when the page first loads.
Our final displayResult function should look something like this:
function displayResult(e) {
    e.preventDefault()
    // get chart
    const chart = document.getElementById('chart');

    //yaxis
    let ysum = (((document.getElementById('inputHeight').value)-1.43)/0.57)*374
    ysum = Math.abs(ysum-374)
    yMark = ysum+chart.offsetTop+37
    yMark = yMark - 11

    // xaxis
    let xsum = (((document.getElementById('inputWeight').value)-36)/88)*734
    xMark = xsum+chart.offsetLeft+32
    xMark = xMark - 11

    //get icon
    let x = document.getElementById('x');

    //position and style icon
    x.style.position = "absolute"
    x.style.top = yMark+"px"
    x.style.left = xMark+"px"
    x.style.fontSize = "20px"
    x.style.fontWeight = "bold"
    x.style.display = "inline-block"
}
Our app is now programmed so that in response to user input and then the clicking of the button, ❌ will be mapped in the correct position on top of the chart.
Entering some typical values now, testing your application should produce something like the following:
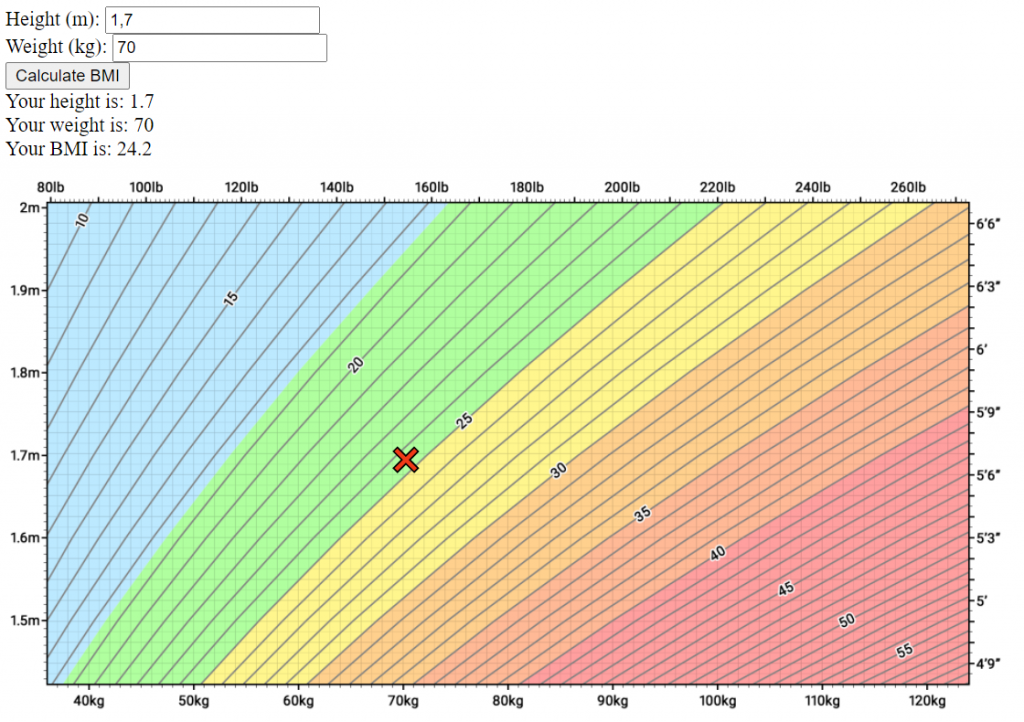
If you made it this far, congratulations! You have created a fully functional application, with input, processing and output (text and graphics).
Finally, let’s add some finish touching to improve the UI.
Finishing touches
Out of range input
You may have noticed that a user can input values that would be out of range on the BMI chart. At present, ❌ would appear off the chart if this occured.
To fix this, we can specify that a user must enter a height and weight that is in range. We don’t actually need JavaScript for this. Instead, we can rely upon HTML by specifying a min and max value for each of the input elements. Here is what the new form markup should look like:
        <form id="form">
            Height (m):  <input id="inputHeight" type="number" min="1.43" max="2" step="any"><br>
            Weight (kg): <input id="inputWeight" type="number" min="36" max="124" step="any"><br>
            <button id="btn" type="submit">Calculate BMI</button>
        </form>
Notice that we also include the attribute step with a value of “any” for both inputs. This is because an issue may occur in some browsers when using a decimal point to specify a minimum or maximum value.
With this, our user is prevented from entering an out of range value.
CSS styling
We could certainly do with some styling! We have left out styling until this point in the tutorial because we wanted to focus on the functionality of the calculator. But it would be a shame to finish without making our work look at least a little more presentable!
        #x {
            display: none;
        }
        #wrapper{
            display: flex;
            flex-direction: row;
            justify-content: center;
            align-items: center;
        }
        #form {
            display: flex;
            flex-direction: column;
            justify-content: center;
            align-content: center;
            text-align: center;
            width: 10rem;
            margin: 0.5rem;
            height: 10rem;
            padding: 2rem;
            margin-top: 1rem;
            border: rgb(50, 50, 50) solid 2px;
            background-color: rgb(250, 250, 250);
            border-radius: 1rem;
        }
        #form > input {
            display: block;
            margin: 0px auto;
            margin-top: 0.2rem;
            border-radius: 5px;
        }
        #form > button {
            background-color: #0275d8;
            color:rgb(230, 230, 230);
            padding: 0.3rem;
            width: 9rem;
            border: rgb(230, 230, 230) 1px solid;
            margin: 0px auto;
        }
        #graphic-container {
            text-align: center;
        }
        #output-container {
            display: flex;
            flex-direction: column;
            justify-content: center;
            align-items: center;
            text-align: center;
            width: 10rem;
            margin: 0.5rem;
            height: 10rem;
            padding: 2rem;
            margin-top: 1rem;
            line-height: 1.1rem;
            border: rgb(50, 50, 50) solid 2px;
            border-radius: 1rem;
            background-color: rgb(250, 250, 250);
        }
Summary
In this tutorial, we have seen how to program a BMI calculator on the basis of user input and present the result in text format and plot it on a BMI chart.
If you enjoyed this project, be sure to take a look at other projects you can try out in our projects section.
And follow our page on Facebook to receive notification when new projects are posted!
Miss something? Here is the full project code:
<!DOCTYPE html>
<html lang="en">
<head>
<meta charset="UTF-8">
<meta http-equiv="X-UA-Compatible" content="IE=edge">
<meta name="viewport" content="width=device-width, initial-scale=1.0">
<title>BMI Calculator</title>
<style>
#x {
display: none;
}
#wrapper{
display: flex;
flex-direction: row;
justify-content: center;
align-items: center;
}
#form {
display: flex;
flex-direction: column;
justify-content: center;
align-content: center;
text-align: center;
width: 10rem;
margin: 0.5rem;
height: 10rem;
padding: 2rem;
margin-top: 1rem;
border: rgb(50, 50, 50) solid 2px;
background-color: rgb(250, 250, 250);
border-radius: 1rem;
}
#form > input {
display: block;
margin: 0px auto;
margin-top: 0.2rem;
border-radius: 5px;
}
#form > button {
background-color: #0275d8;
color:rgb(230, 230, 230);
padding: 0.3rem;
width: 9rem;
border: rgb(230, 230, 230) 1px solid;
margin: 0px auto;
}
#graphic-container {
text-align: center;
}
#output-container {
display: flex;
flex-direction: column;
justify-content: center;
align-items: center;
text-align: center;
width: 10rem;
margin: 0.5rem;
height: 10rem;
padding: 2rem;
margin-top: 1rem;
line-height: 1.1rem;
border: rgb(50, 50, 50) solid 2px;
border-radius: 1rem;
background-color: rgb(250, 250, 250);
}
</style>
</head>
<body>
<div id="wrapper">
<form id="form">
Height (m): <input id="inputHeight" type="number" min="1.43" max="2" step="any"><br>
Weight (kg): <input id="inputWeight" type="number" min="36" max="124" step="any"><br>
<button id="btn" type="submit">Calculate BMI</button>
</form>
<div id="output-container">Your result will appear here</div>
</div>
<!-- new HTML below -->
<div id="graphic-container">
<img id="chart" src="https://upload.wikimedia.org/wikipedia/commons/c/cc/BMI_chart.png" alt="BMI chart" width = "800px">
<span id="x">❌</span>
</div>
<script>
const inputHeight = document.getElementById('inputHeight');
const inputWeight = document.getElementById('inputWeight');
const form = document.getElementById('form');
form.addEventListener('submit', runCalculation);
function runCalculation(e) {
e.preventDefault()
let result;
result = inputWeight.value/(inputHeight.value*inputHeight.value);
const output = `
<span>Your height is:<br><b>${document.getElementById('inputHeight').value} metres</b></span><br>
<span>Your weight is:<br><b>${document.getElementById('inputWeight').value}kg</b></span><br>
<span>Your BMI is:<br><b>${result.toFixed(1)}</b></span><br>
`
const outputContainer = document.getElementById('output-container');
outputContainer.innerHTML = output;
}
form.addEventListener('submit', displayResult);
function displayResult(e) {
e.preventDefault()
// get chart
const chart = document.getElementById('chart');
//yaxis
let ysum = (((document.getElementById('inputHeight').value)-1.43)/0.57)*374
ysum = Math.abs(ysum-374)
yMark = ysum+chart.offsetTop+37
yMark = yMark - 11
// xaxis
let xsum = (((document.getElementById('inputWeight').value)-36)/88)*734
xMark = xsum+chart.offsetLeft+32
xMark = xMark - 11
//get icon
let x = document.getElementById('x');
//position and style icon
x.style.position = "absolute"
x.style.top = yMark+"px"
x.style.left = xMark+"px"
x.style.fontSize = "20px"
x.style.fontWeight = "bold"
x.style.display = "inline-block"
}
</script>
</body>
</html>


